Developing an Early COVID-19 Tracker
📖 Introduction
In early April 2020 to help people track the COVID-19 pandemic in the UK & Internationally, I decided to put together an open source Dashboard which tracks cases and their outcomes from reliable sources such as WHO, Public Health England and the CDC.
The decision came after a Southampton Taxi driver on our way to a wedding explained that COVID-19 was the 19th strain of Coronavirus, so no one should worry, which of course was wrong... The day after, with a slight hangover, I produced a Dashboard with basic COVID-19 data and a FAQ with information manually compiled from WHO and PHE.
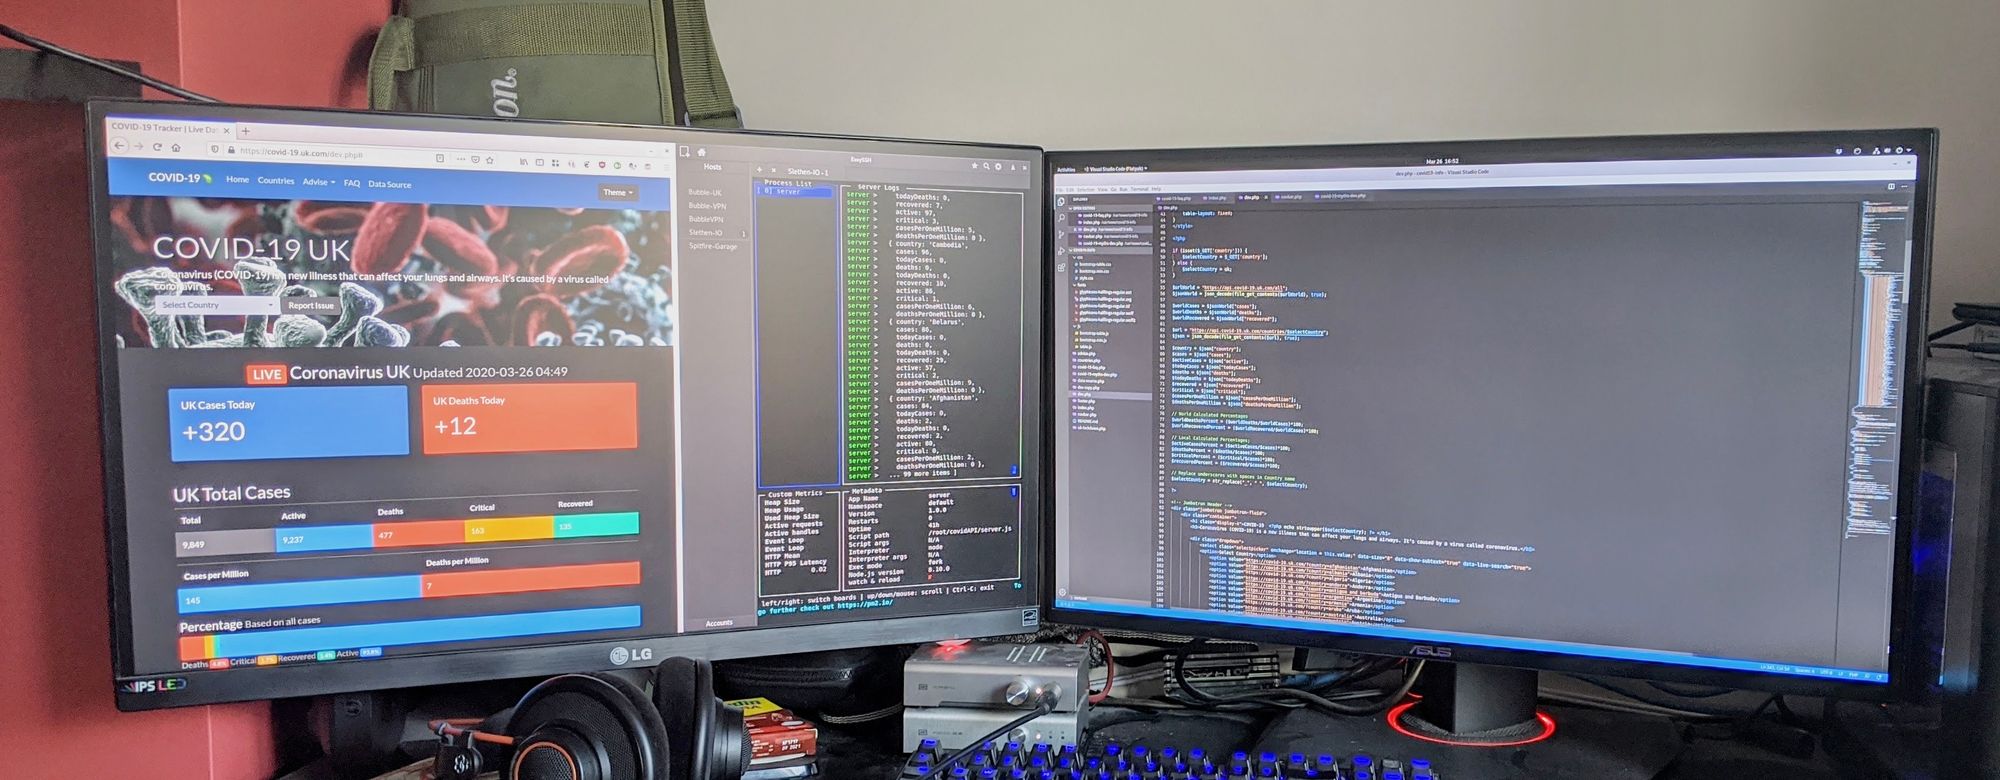
After the first lockdown was announced in the UK on March 23rd, I was able to use the time saved from travel to put even more effort into my COVID Tracker. This included live data on cases, deaths, patients on ventilators, and calculated percent-based data. At the time, this was one of the more detailed and well-presented COVID-19 dashboards.
Now that I've explained why, I want to show you a bit about how.
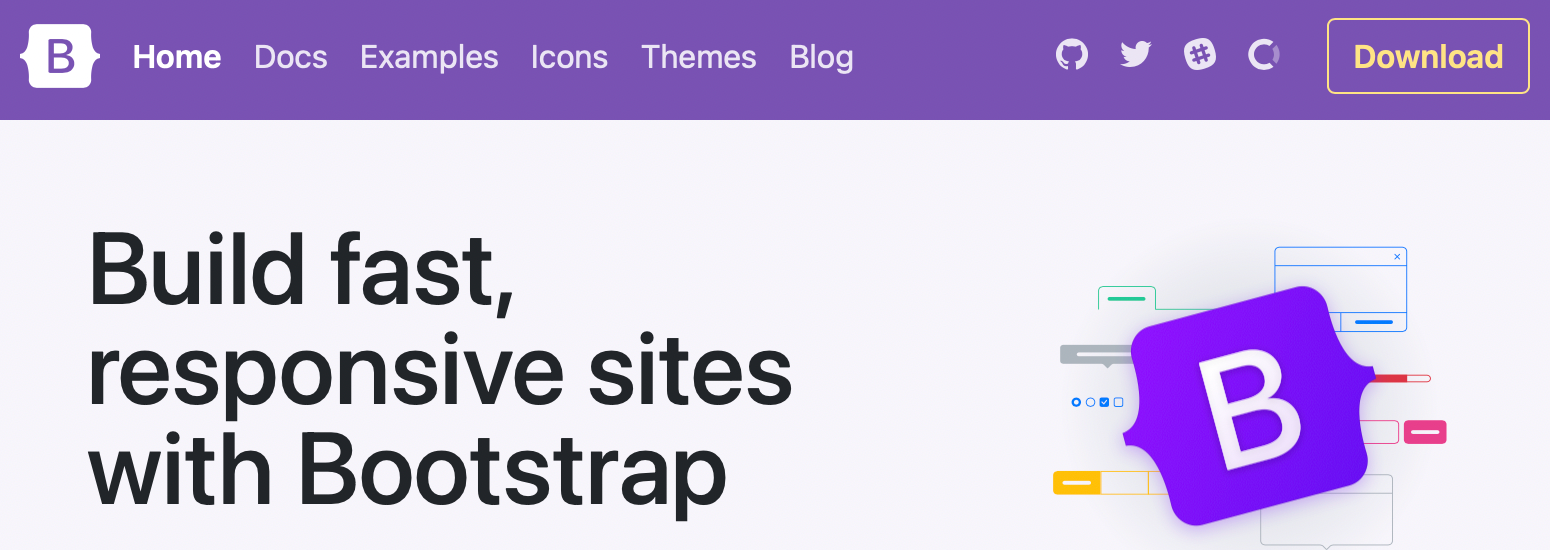
🧱 Framework - Bootstrap
Nothing exciting here; Bootstrap is a great way to go for most developers who want to quickly prototype web apps. I've used it with previous PHP projects and am fairly comfortable with its design language. Bootstrap also makes it relatively easy to create a dark/light version thanks to themes supplied by Bootswatch.
👨🏼💻 PHP & Design
PHP may seem outdated in what seems to be a Javascript dominated world, but it's a lean programming language with a small server footprint. Ideal when you're running many customer sites & services on the same server!
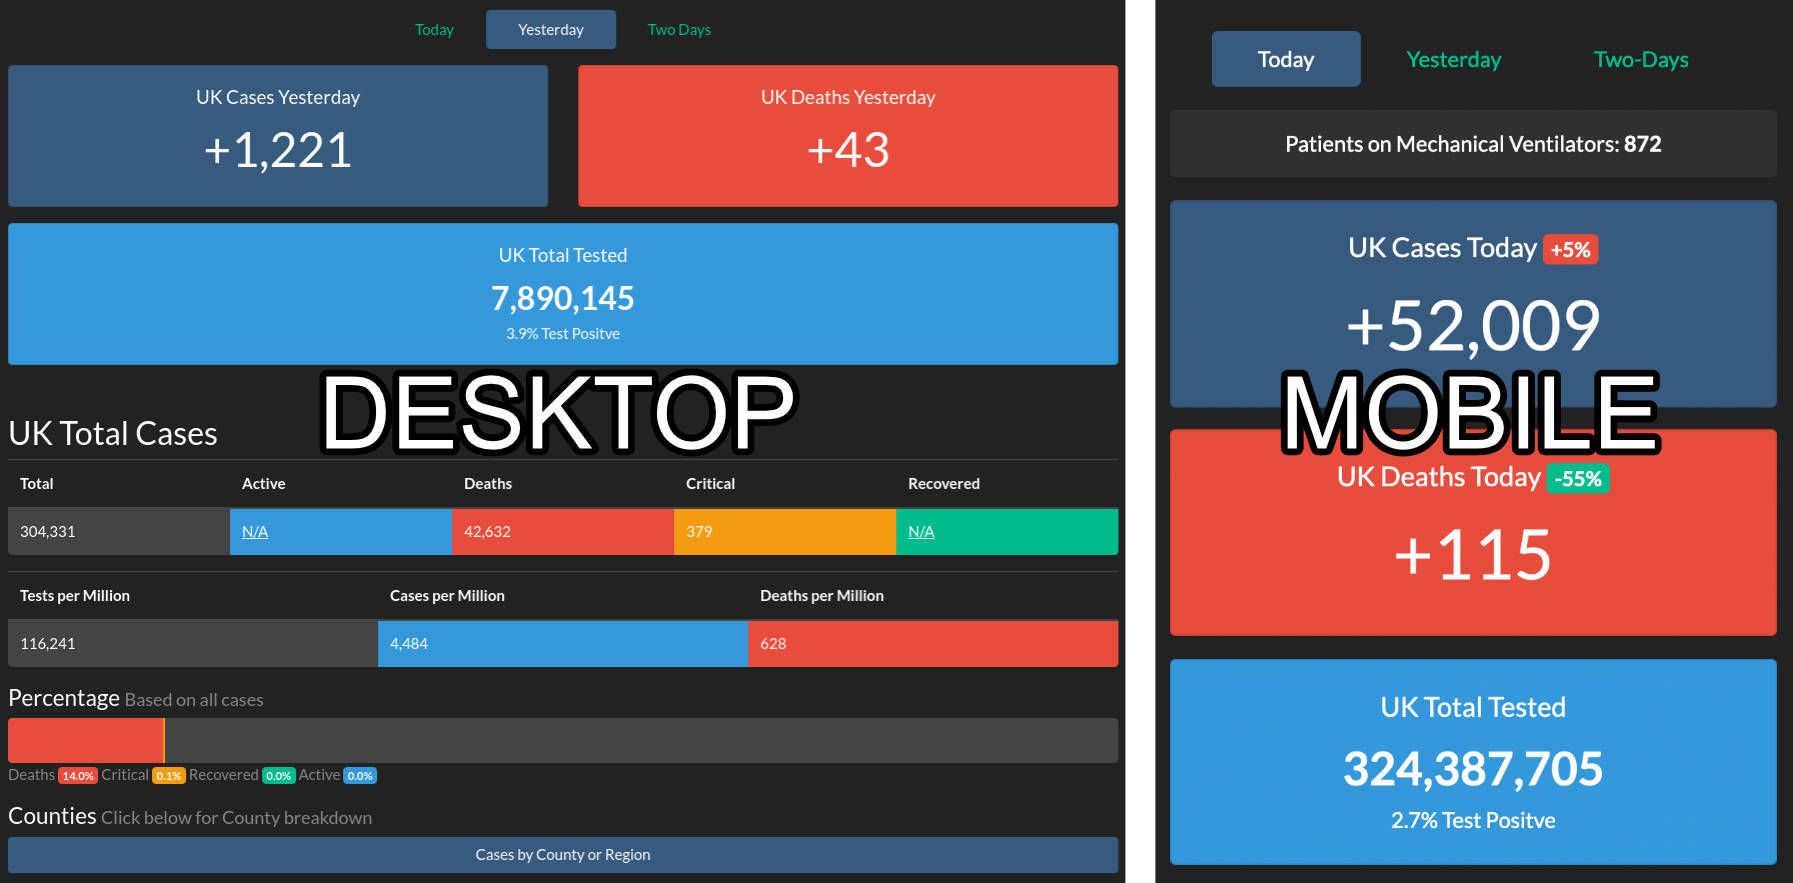
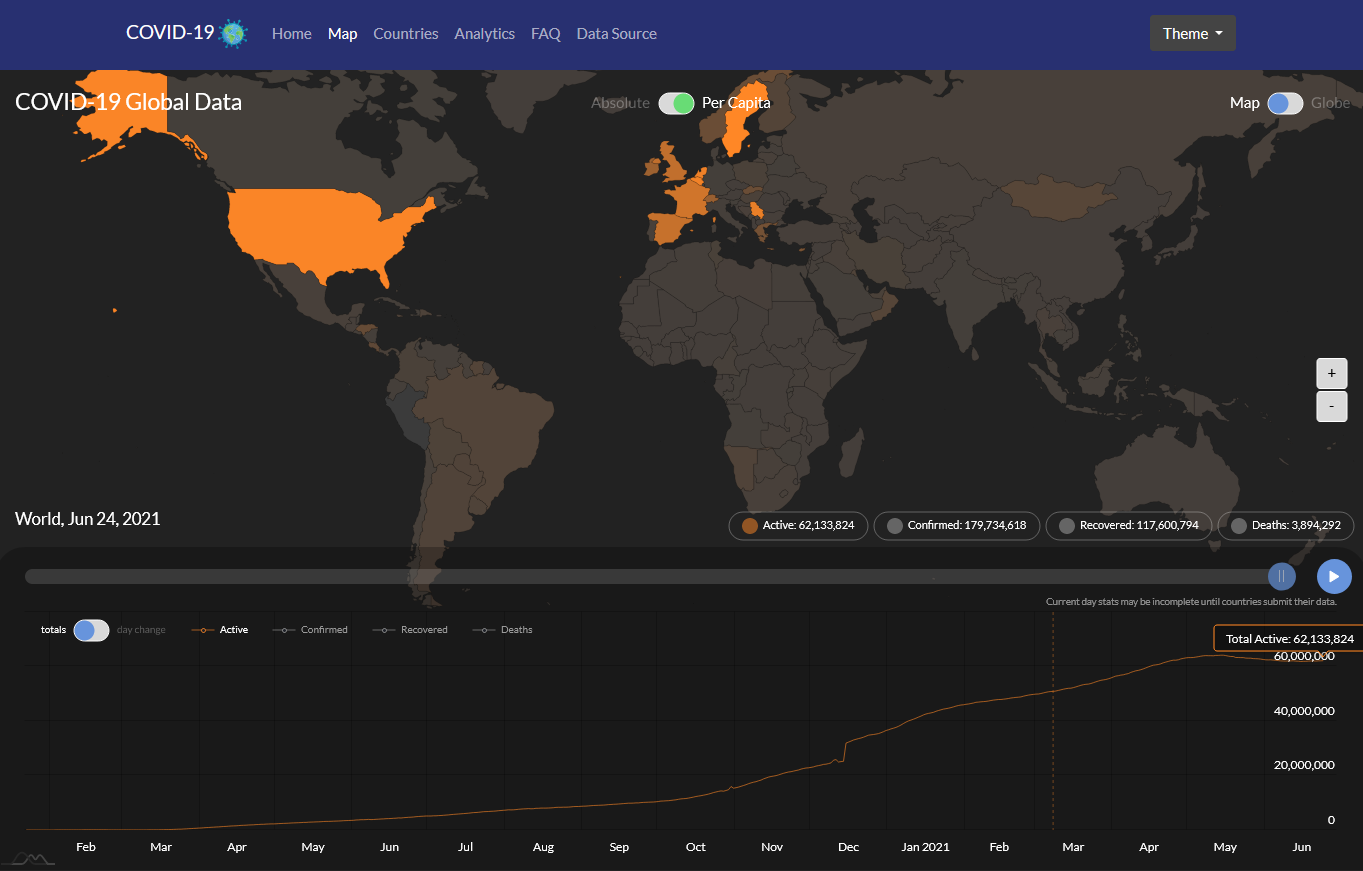
I've always been a fan of simple design, and I wanted to present data in a way that was simple to understand, focusing on information that I thought was important, and making sure it was legible on all platforms: desktop, tablet, and mobile. I feel my design is very approachable without complicated graphs or confusing language.
🍴 Fork It
In March 2020, there wasn't much in terms of COVID-19 Data API's. There was a small project on GitHub which I forked and modified to allow 3 days of data as well as a few simple formatting changes to make the JSON output more PHP friendly. I maintained and hosted this fork on my server for a year until the original project grew and became the Open Disease Data API.
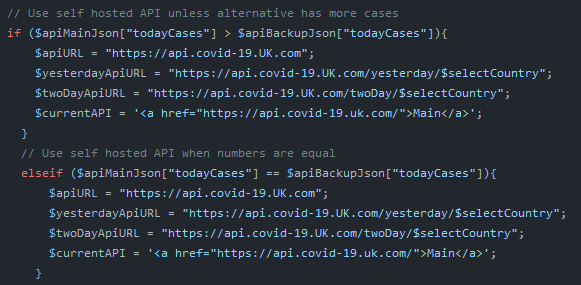
As of recently, I would check if my self-hosted API was live and use ODDA as a backup, but since late 2021, they have become reliable enough that I've stopped maintaining my API fork.
I still use the Open Disease Data API for basic data on all countries, pulled from worldometer, as well as US state-specific information.
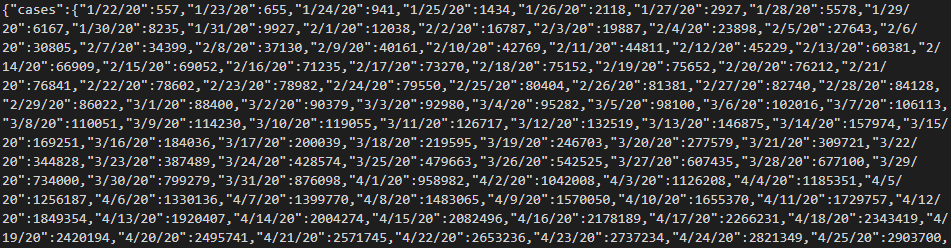
🚕 JSON
As mentioned, the original data was pulled using API's built around getting the latest from worldmeters. As the pandemic progressed, the UK & other governments started creating their own JSON API's, allowing me to get more detailed data straight from government sources, such as:
- Cases per County/Region
- Rates per County/RegionNHS
- Advice from official API
- 1st , 2nd & Total vaccines doses given
Unfortunately, the UK government didn't do a great job of making their API requests very PHP friendly, mainly focusing on support for Python, JavaScript & R. This and a few other issues I'll mention in the next section led to me pulling UK Gov data with Python.
🐍 Caching & Python
After 6 months, I started noticing my tracker would regularly go down at peak traffic hours and occasionally not recover. It didn't take long to realise this was caused by the very large JSON requests timing out PHP.
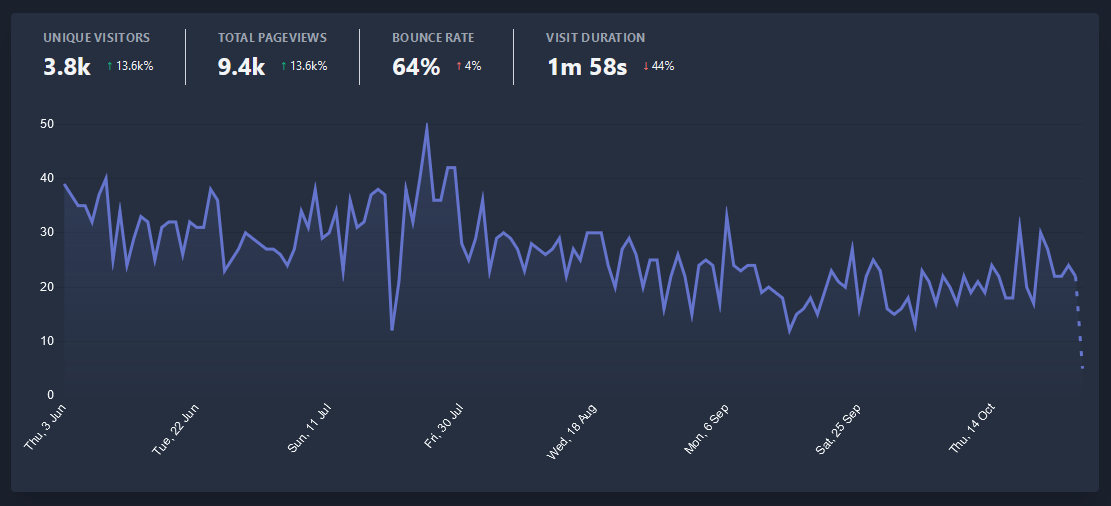
This made me consider building a database, but with less free time as life/work became busier, I opted to pull the large government structures with Python and locally cache them. Python is called by CRON every 5 minutes and stores its JSON output locally, reducing external requests on page load. This so far has solved the problem! Even during the peak of the site, when I was getting 4000 unique views a day.
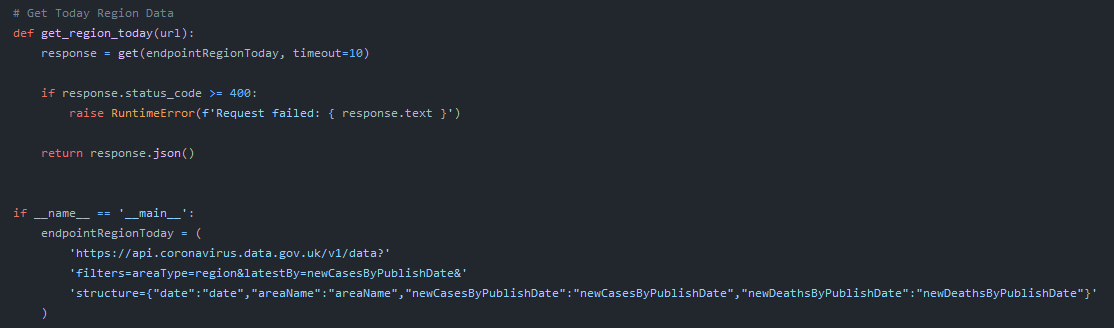
Using Python for UK Gov requests also meant I was unable to pull a lot more official data without running into issues with their very strangely formatted JSON API strings, and let me follow the API guidelines. This turned out to be very useful when they updated to a new version and added vaccine data.
🏁 Conclusion
Creating this site not only taught me a lot about building scalable full stack web applications, but also forced me to learn a lot about hosting, deploying, and maintaining by far the most popular web service that I've solely developed.
Thinking back to when I was developing covid-19.uk.com from our lounge while my wife was working nightshifts at the hospital, I believe this project kept me sane and busy, as well as hopefully helped others during a very difficult and uncertain time. I only hope there won't be a V2.
 Slethen


Comments ()